Have scientists been measuring traffic wrong all this time?
Transportation is changing, compelling experts to reexamine the way they analyze transport problems – and they may have been operating with faulty data for decades, argues Todd Litman, executive director of the Victoria Transport Policy Institute, in a recent blog post on Planetizen.
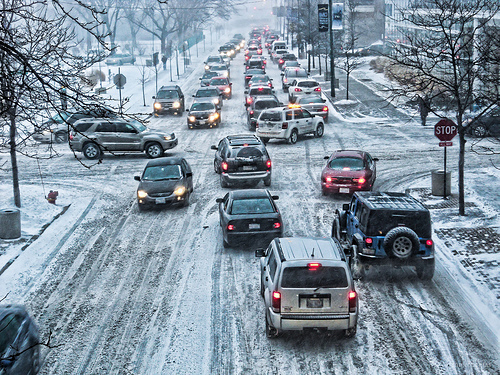
Courtesy State Farm.
In the past, efforts to figure out how effective transportation systems are tended to hinge on a few key indicators, among them: “motor vehicle traffic speeds, using indicators such as roadway level-of-service, the Travel Time Index and their variants such as the INRIX Congestion Scorecard and the TomTom Traffic Index, which measure congestion intensity,” writes Litman.
Long story short, analysis was based on congestion intensity, which is how much traffic speeds plummet during peak driving times.
Congestion intensity is handy for individual travelers to consider when they’re making short-term transport plans; for example, when you plan out how to get from your office to an appointment during the inevitable morning rush hour. But Litman argues that relying on congestion intensity for “strategic planning purposes” is pointless, because it doesn’t account for congestion exposure. (Congestion exposure just means how much people have to drive during those peak driving times.)
The factors that worked when analyzing traffic congestion in the past — such as motor vehicle traffic speeds and congestion intensity — do not take congestion exposure into account. These old analyses overlook possible traffic-reducing methods, such as “from shifting modes or more accessible development patterns which reduce travel distances,” writes Litman.
It’s necessary to also consider congestion costs — take per capita annual congestion delay, for example. In a nifty Common Congestion Indicator table (check it out with the original blog post, here), Litman explains a variety of typical indicators and their usefulness. Consider, for example, Roadway Level-Of-Service (LOS) — which is defined as “Intensity of congestion on a road or intersection, rated from A (uncongested) to F (most congested).” LOS is not a comprehensive nor a multi-modal indicator.
Average Commute Time functions as the rare indicator which is both comprehensive and a multi-modal indicator. Other indicators include Multi-modal Level-Of-Service (LOS) (defined as “service quality of walking, cycling, public transport and automobile, rated from A to F”), which isn’t comprehensive but is multi-modal; Travel Time Index, Average Traffic Speed, Congested Duration, Delay Hours, and Congestion Costs. (Bear in mind, as Litman notes, that there are a variety of indicators and few are both comprehensive and multi-modal.)
Still, despite the value of these indicators, more comprehensive and more multi-modal indicators are necessary to “evaluate planning decisions that involve trade-offs between traffic speeds and other accessibility factors.” (Learn more about multi-modal indicators in this handy Victoria Transport Policy Institute report on multi-modal transportation.)
One example of such a trade-off would be transforming a general traffic lane into a bus lane. If we were to analyze congestion based on congestion intensity alone, the lane conversion project would be worthwhile only if the bus lane hosted enough former drivers to increase speeds on the other general traffic lanes. But that analysis doesn’t account for the time transit passengers save because of the bus.
Congestion cost indicators, on the other hand, take into account roadway performance based on “person-travel,” not “vehicle-travel,” distinguishing the time savings resulting from the new bus-only lane on traffic-ridden roads. This makes for a fairer analysis, since the average bus passenger consumes less than a tenth of space on a road as an auto passenger, writes Litman.
The takeaway? By evolving from a congestion-intensity-based analysis towards a congestion cost-based one, we will probably see an increase in bus lanes, in addition to “more compact development, and more use of transportation demand management strategies.” That is, the transportation landscape will change, if we begin to use different models to measure our use of it.
Like this topic? Check out our related products:
-
Advance Traffic Control Signs
-

Custom Road Signs

Category: Automotive, Trends
